Modern Monitoring: From Raw Metrics to Actionable Intelligence

Most organizations have metrics. Few have answers. Traditional monitoring stacks collect data, but without structure and correlation, they fail when it matters most.
CPU load is high. Response times spike. Memory usage increases. These metrics are symptoms, not root causes. Effective observability goes beyond collection. It enables your team to detect patterns, identify failures, and respond with precision.
Recommended Observability Stack
- Prometheus for time-series metric collection using pull-based scraping
- Node Exporter, Blackbox Exporter, and custom exporters for granular visibility
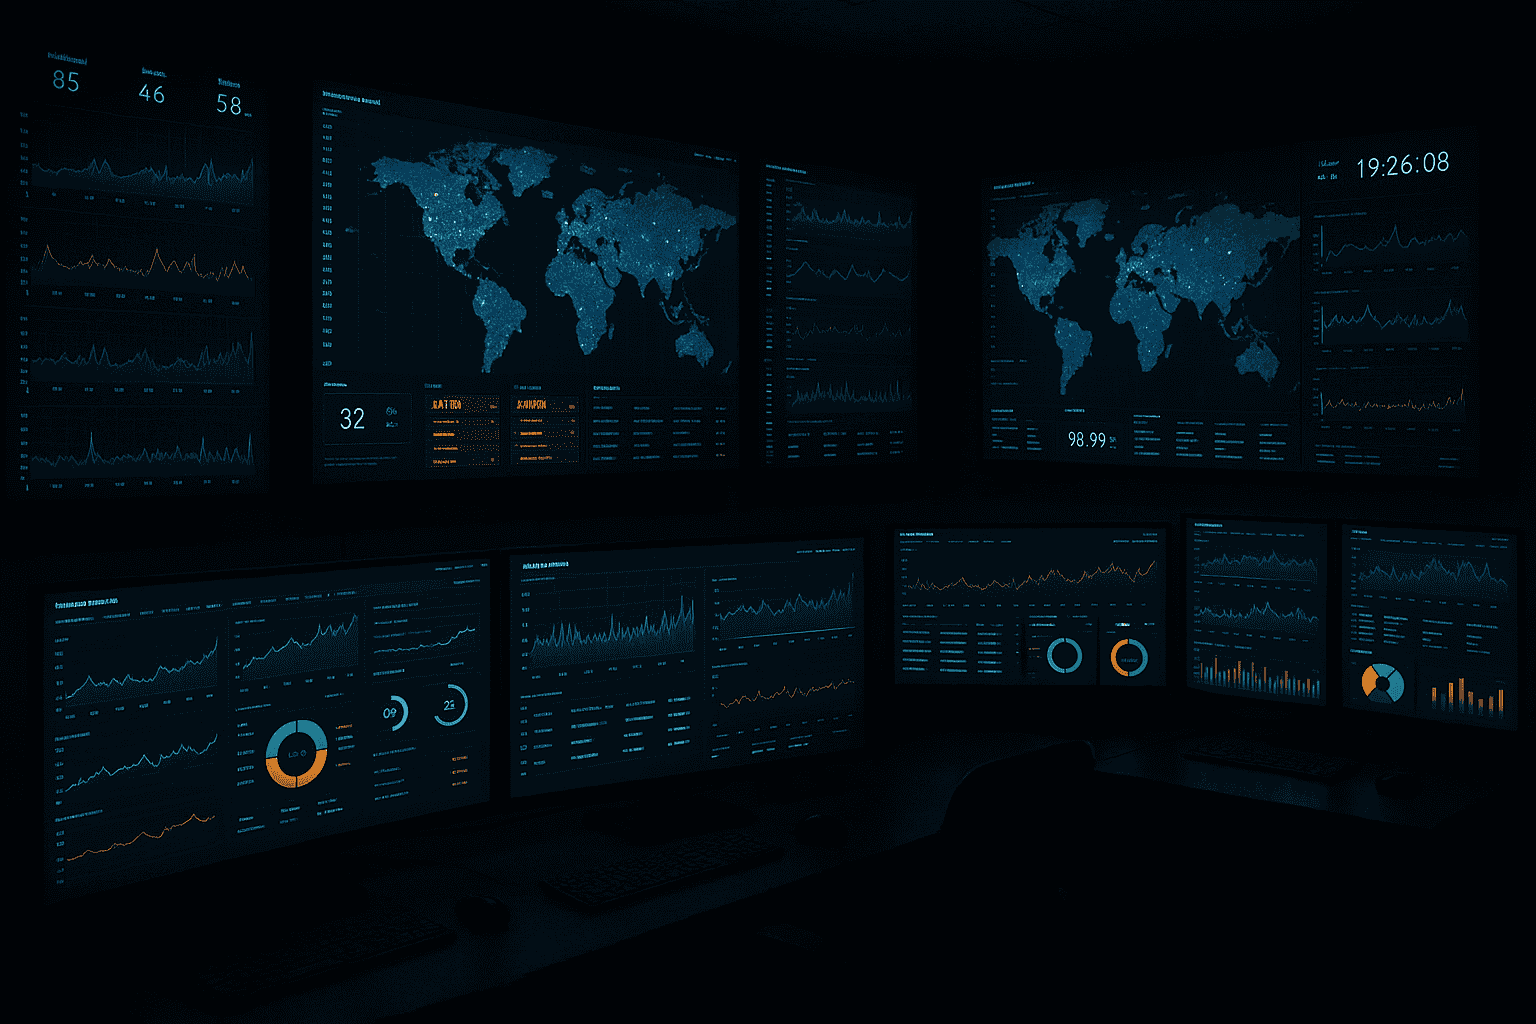
- Grafana for unified dashboards, correlation, and anomaly detection
- Loki for centralized log aggregation and filtering by labels
- Alertmanager for routing, grouping, and silencing alerts based on dynamic rules
Key Principles
- Everything must be measurable: latency, throughput, saturation, errors
- Logs, metrics, and traces should be correlated across services and environments
- Alert fatigue is a design flaw, not a trade-off
- Dashboards should reflect business outcomes, not just infrastructure stats
A mature monitoring setup provides engineers with context before they even investigate. It shifts your team from reactive firefighting to proactive reliability engineering.
If your stack only shows when things break, you’re flying blind. Modern observability gives you operational intelligence at every layer.
#Monitoring #Observability #DevOps #Prometheus #Grafana #SRE #CloudArchitecture